top of page

Dynamic Graphs and Charts
Back / Dynamic Graphs and Charts
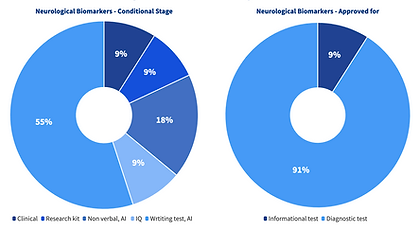
Note: for different types of aging clocks, in the suggested categorization framework, we estimated combined Technology Readiness Level (TRL) using a standard industry classification metric developed by NASA and measuring any technological solution from 1 to 10 — 1 being a stage of technological research, and 10 being a commercially available solution. We have identified TRL for select single biomarkers in each aging clock category, and then applied an average for a category as a whole.
The following infographics show the TRL evaluation and condition state monitoring of different biomarkers, which was performed in advance of the Q3 2021 report. The same evaluation of the updated list of panels will be performed upon full data acquisition.


bottom of page